Copenhagen Cycling Ecosystem Analysis (Freelanced)
Scraped and analyzed Copenhagen's bicycle retail ecosystem end to end, from Google Maps listings to underserved-market clustering.
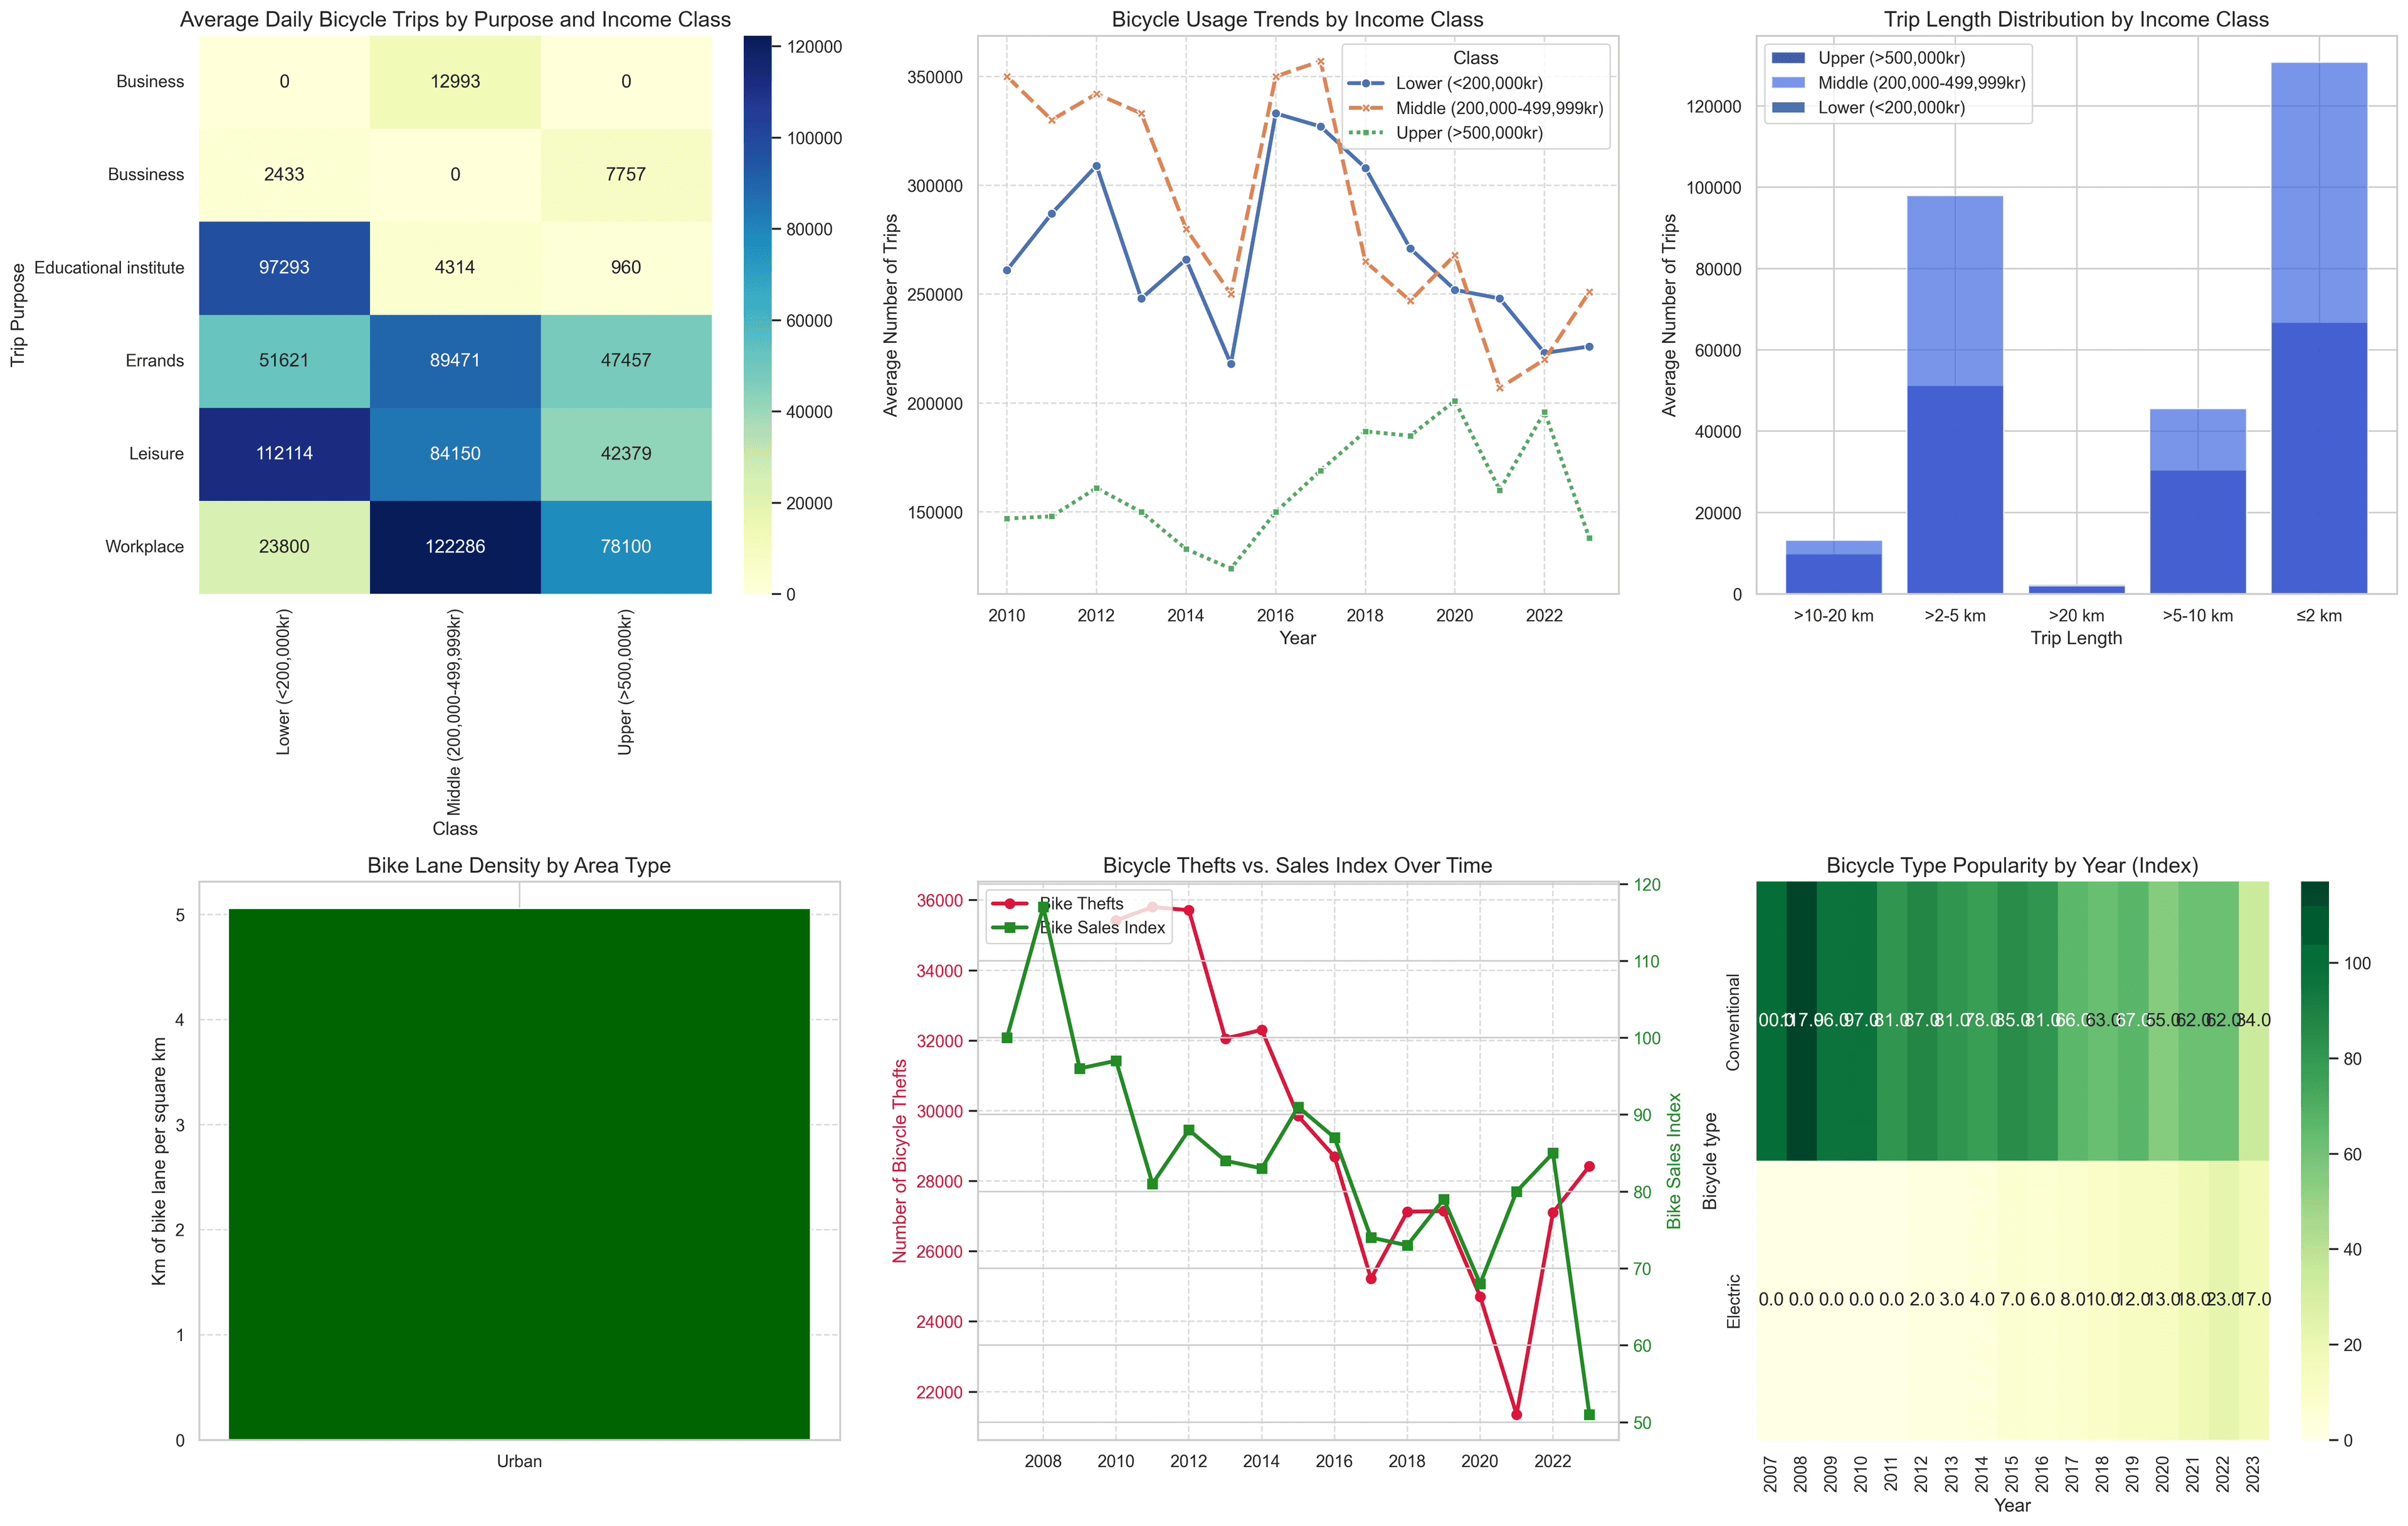
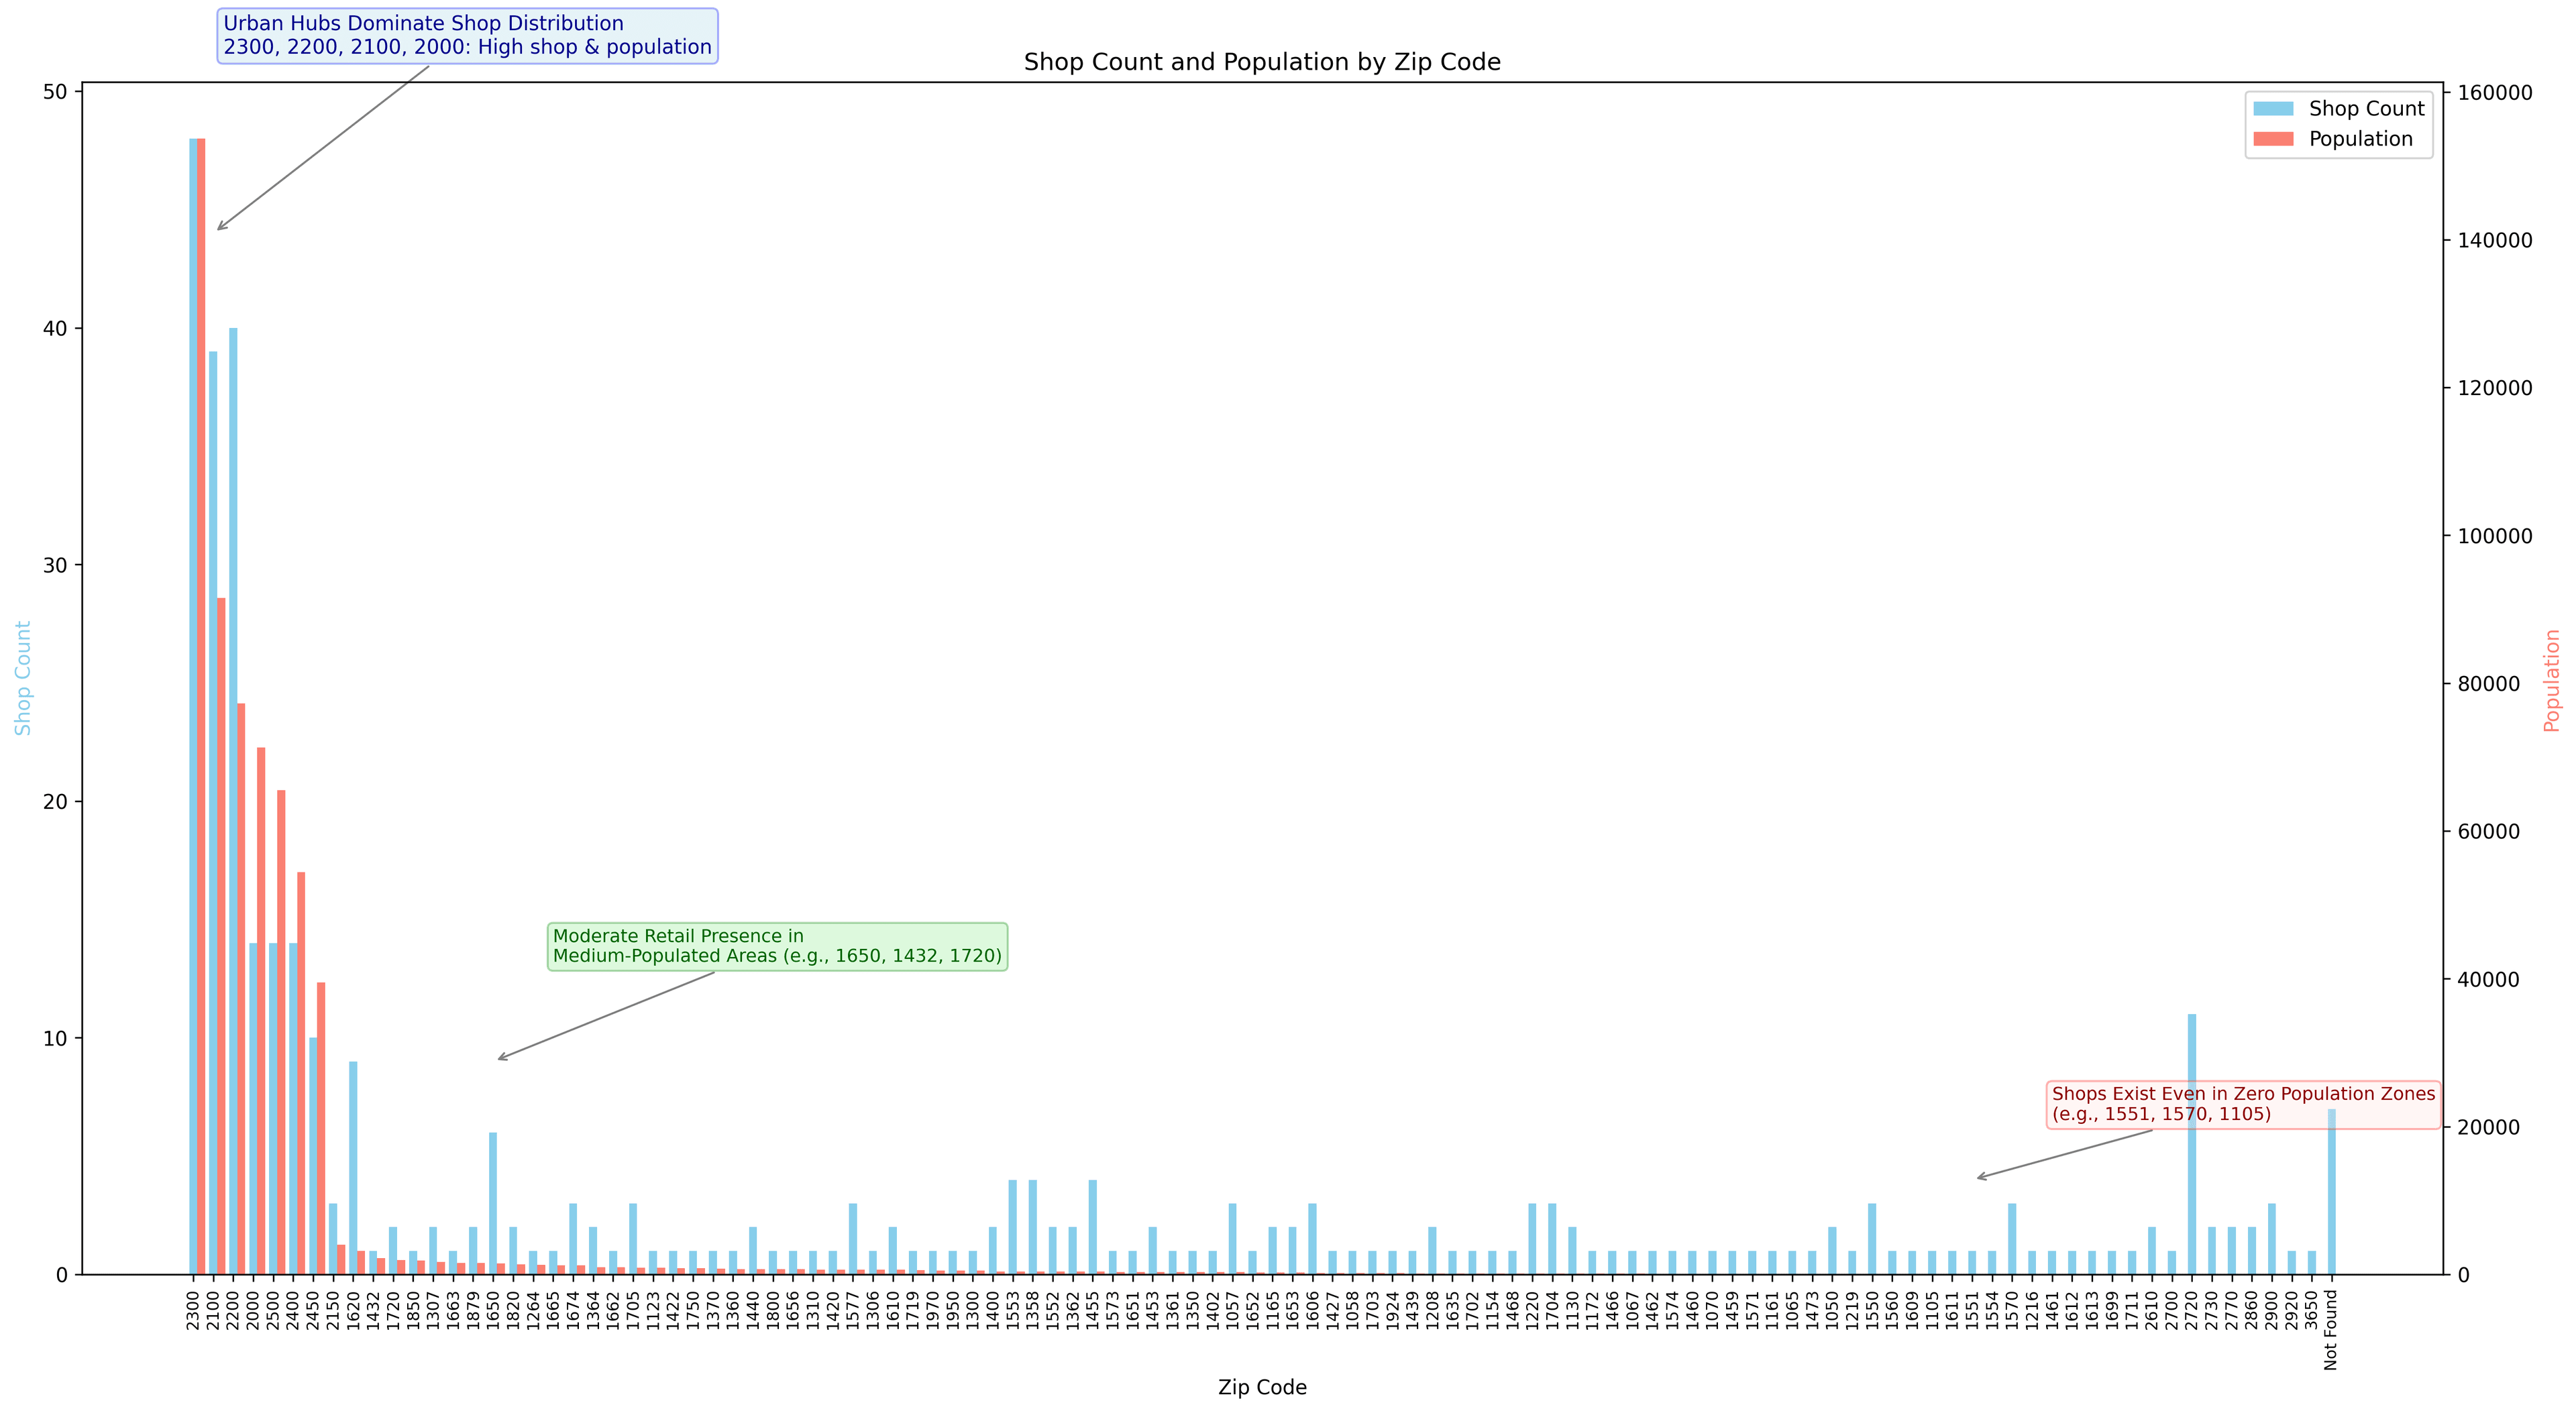
An end-to-end data analysis pipeline studying Copenhagen's bicycle retail and infrastructure ecosystem: Selenium scrapes 311 bicycle-related business listings (name, category, rating, address) from Google Maps, regex extracts Danish zip codes from addresses, and the data is merged with official population, income, transport, and bike-lane statistics across 17 zip codes. Interactive Folium maps (shop density heatmaps, category marker clusters, bike-lane coverage, Haversine-based same-category-neighbor proximity) surface the geospatial picture, K-Means clustering on population-per-shop ratio flags underserved zip codes as concrete market-expansion targets, and linear regression models usage and sales trends across income classes over multiple years. A small Dash app makes the shop dataset interactively explorable.
What I built
- Scraped 311 bicycle-related business listings (name, category, rating, address, About attributes) from Google Maps using Selenium.
- Extracted Danish zip codes from addresses via regex and merged the scraped data with official population, income, transport, and bike-lane statistics across 17 zip codes.
- Built interactive Folium maps: shop density heatmaps, category marker clusters, regional bike-lane coverage, and Haversine-distance same-category-neighbor proximity maps.
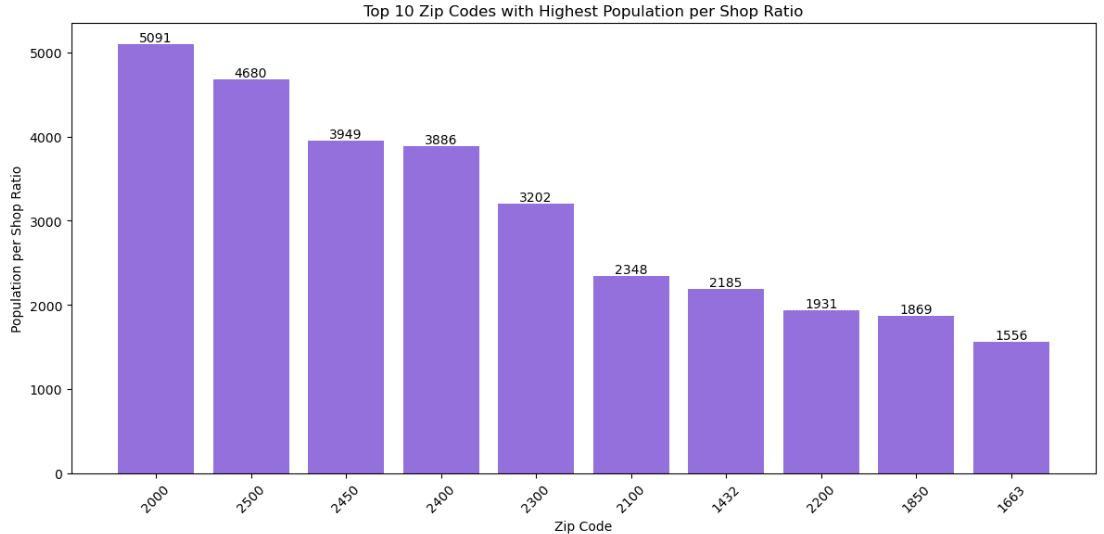
- Applied K-Means clustering on population-per-shop ratio to flag underserved zip codes (zip 2000: about 5,091 people per shop) as concrete market-expansion targets.
- Modeled bicycle usage and sales trends across income classes and time with linear regression on multi-year government transport survey data.
- Built a Dash app for interactively exploring the shop dataset.
Tech stack
Key results
311
Shops scraped
17
Zip codes analyzed
~5,091 people/shop
Most underserved zip
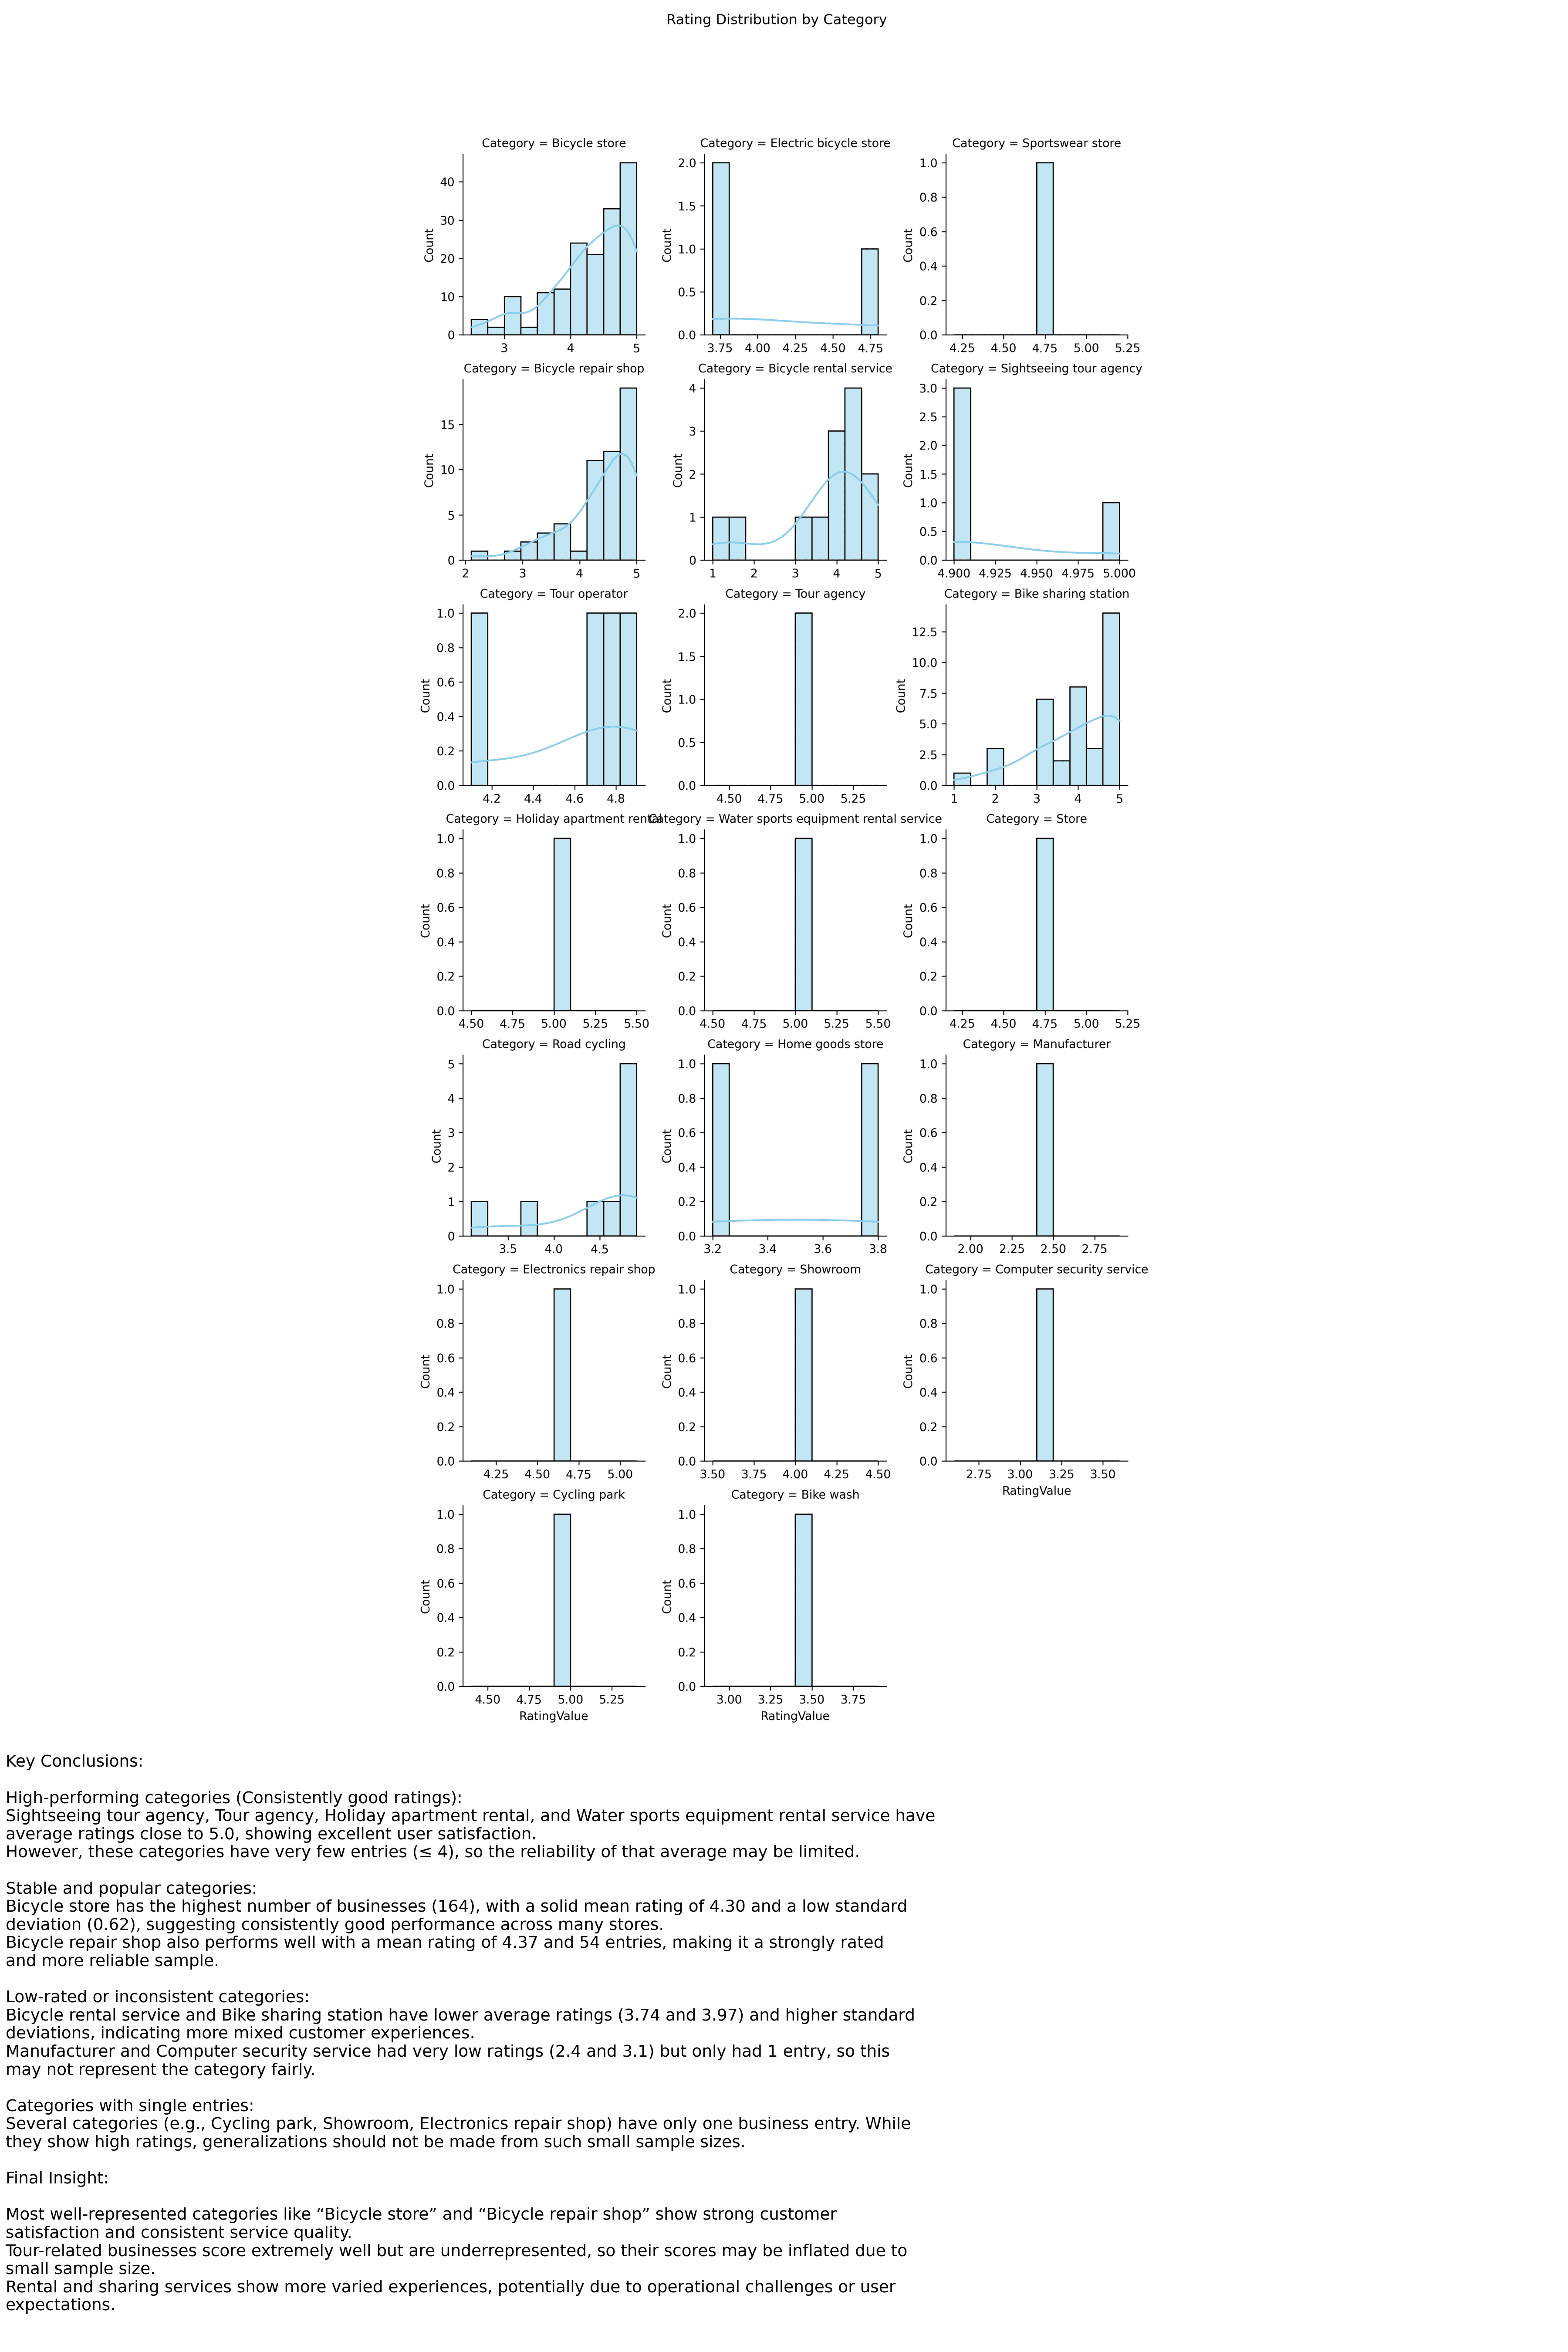
Repair shops (4.37 avg)
Top-rated category